Detecting Pneumonia
April 18, 2023
Pneumonia is an infection that inflames the air sacs in both lungs. It is one of the leading causes of death in Singapore and worldwide. Accounting for 20.7%, 18.8% and 18.4% of deaths in Singapore in 2019,2020 and 2021 respectively, according death statistics retrieve from HealthHub. As for worldwide, statistics has shown that 2.5 million people have died from pneumonia in 2019
Pneumonia can be caused by viral, bacterial and fungi infections. Common pneumonia infections are contagious and can spread from person to person or through the contact with surfaces or objects that are contaminated by the bacteria or viruses. One example of a viral infections that can cause pneumonia which is common now is the coronavirus infection
However upon proper detection and treatment, many cases of pneumonia can be cleared without complications. One of the effective ways to identify signs of an inflammation will be Chest X-ray. Through x-rays, doctors will also be able to know the location and extent of this inflammation.
Mild cases of pneumonia can be effectively treated with antibiotics, antiviral drugs, or antifungal medications. However, if the patient has any underlying health conditions, hospitalization may be necessary, and they may require respiratory and oxygen therapy in addition to antibiotic injections.
With statistics in Singapore showing that roughly 11,000 patients is admitted to hospitals with pneumonia and comparing it with the number of death caused by pneumonia in 2021. We can see that about 6000 patients recovers from pneumonia per year.
Exploratory Data Analysis
Exploring the number of images in train, test and validation folders For the exploratory data analysis, we have a total of three different dataset for the train, test and val data. In the train data, we have a total of 5216 data with 1341 normal images and 3875 pneumonia images. For the test data, there's a total of 624 data with 234 normal images and 390 pneumonia images. Lastly, for the validation data, there's a total of 16 data with 8 normal and 8 pneumonia images.

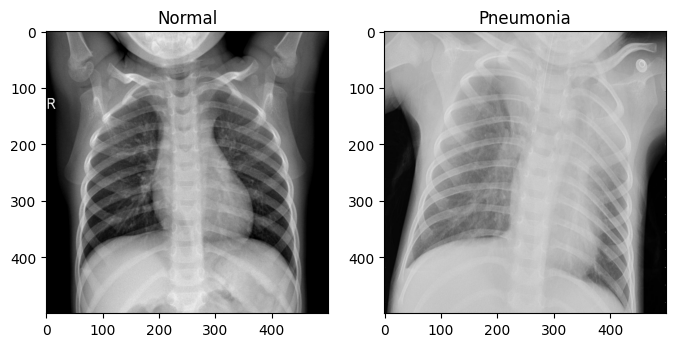
Exploring the pixel intensity distribution
Normal has more pixels that are more spread out across high to low pixel intensity. Pneumonia has more pixels that are of high pixel intensity resulting in pneumonia being present. This means that if pneumonia is present in the x-ray film, the pixel intensity is supposedly higher and the spread of the pixels should be smaller and closer together.
![]()
Applying canny edge detection
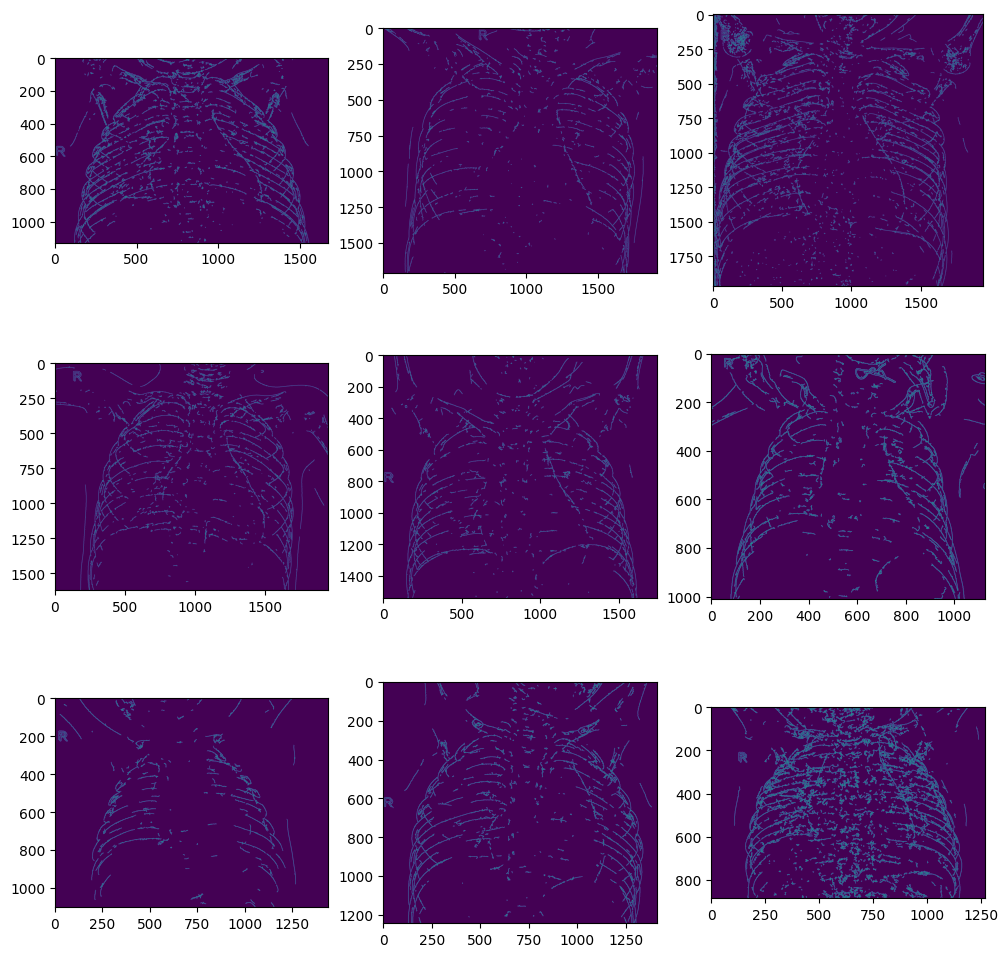
The use of canny edge detection can be useful in extracting structural information from different objects and dramatically reduce the amount of data to be processed.
From the normal canny images, we can see that the entire outline of the ribcage is visible and big patches of dots are not seen in the images.
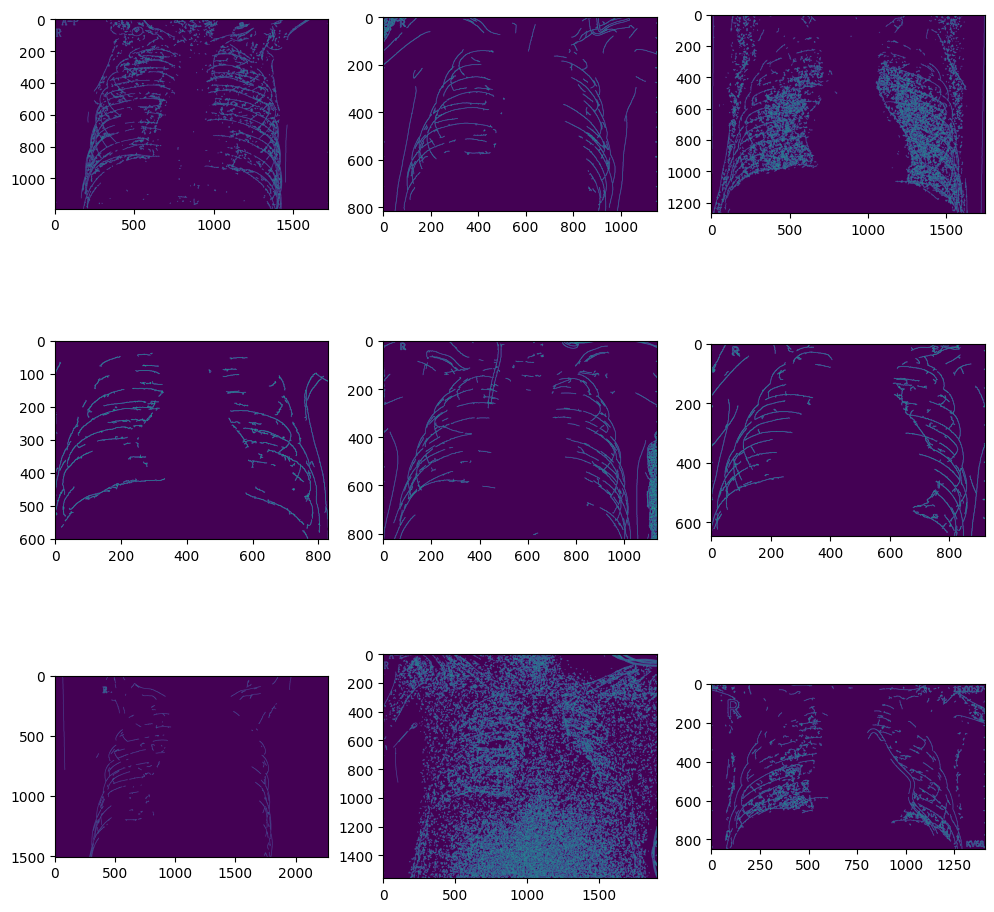
From the pneumonia canny images, we can see that the outline of the ribcage are less obvious as compared to the normal and big patches of dots can be easily seen in some images.
Tackling class imbalance
Weighted loss function is a technique that can be used to address the issue of class imbalance in binary classification problems. In this case, for our train dataset, the number of pneumonia images is significantly greater than that of the normal images, which can cause the model to have poor performance on the minority class.
Image Preprocessing
Performing some basic image transformation
- Rotate
- Width Shift
- Shear
- Zoom
- Center
- Standard Normalization
We found out that by introducing some form of randomness into dataset can lead to better accuracy. Besides, we have to scale down the images to 64x64 pixels in view of reosurce constraints.
Convolutional Neural Network (CNN)
CNN is a type of neural network that are specifically designed for processing data that has a grid-like structure, such as images, video, and audio. CNNs are commonly used for image classification, object detection, and segmentation tasks. CNNs are trained using backpropagation and stochastic gradient descent to minimize a loss function. During training, the weights of the filters and the fully connected layers are updated iteratively to improve the network's performance.
model_balanced = Sequential([
  Conv2D(32, (3, 3), activation="relu", input_shape=(64, 64, 3)),
  BatchNormalization(),
  MaxPooling2D(pool_size = (2, 2)),

  Conv2D(64, (3, 3), activation="relu"),
  BatchNormalization(),
  MaxPooling2D(pool_size = (2, 2)),

  Conv2D(128, (3, 3), activation="relu"),
  BatchNormalization(),
  MaxPooling2D(pool_size = (2, 2)),

  Flatten(),

  Dense(activation = 'relu', units = 128),
  Dense(1, activation='sigmoid')])

model_balanced.compile(loss='binary_crossentropy',
              optimizer='adam',
              metrics=['accuracy'])

model_balanced.summary()
After modelling the CNN architecture, we proceed to train our model with the weighted loss function to reduce biasness using 10 epochs of forward and backpropagation.
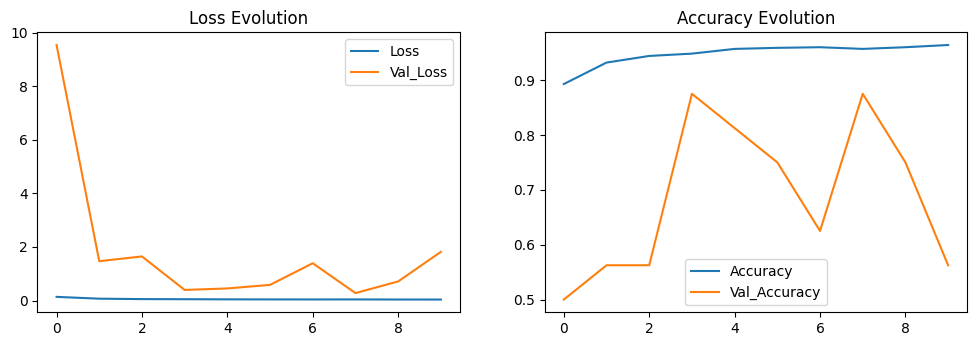 Based on the perfomance of model, we can deduce that the CNN model is rather accurate as the validation accuracy is closely follows the training accuracy. When comparing the training and validation loss, it also shows that the validation loss closely follows the training loss overtime. In order to maximise the training and validation accuracy, we have tuned several hyperparameter and this was the result. When tuning the hyperparameters, we were also mindful of the fact that over tuning the model could result in overfitting and under tuning the model could result in underfitting.
Having evaluated our model, we ran our model against unseen validation data to ensure that our model is performing to a certain degree of accuracy.
Densely Connected Neural Network (DensetNet)
DenseNet is a type of CNN that emphasizes feature reuse and encourages the flow of information across different layers of the network. DenseNet also require fewer parameters as compared to CNN as there is no need to learn redundant feature maps. The basic idea behind DenseNet is to connect all layers in a feed-forward fashion. Unlike traditional CNNs, which stack convolutional layers on top of each other, DenseNet connects each layer to every other layer in a feed-forward fashion. In this way, each layer receives information not only from the preceding layer but also from all the preceding layers in the network. DenseNet also incorporates a technique called "feature concatenation", which involves concatenating the feature maps produced by each layer before passing them on to the next layer. This encourages the network to reuse features from earlier layers, which can help to reduce the number of parameters required and improve performance. We have chosen DenseNet121 for a basic comparison between the state-of-the-art CNN architecture and the primitive implementation of a basic CNN.
To fine-tune the pre-trained model for our specific task, the first 101 layers of the pre-trained model are frozen by setting their trainable attribute to False. This allows only the remaining layers, starting from layer 101, to be trained during the fine-tuning process. This also helps prevent overfitting of the model.
lrs = tf.keras.callbacks.ReduceLROnPlateau()
int_lr = 0.0001
epoch = 10
batch_size = 32

early_stoppage = EarlyStopping(monitor='val_loss', patience=10)

# DenseNet Model
densed_model = DenseNet121(include_top=False,input_tensor= tf.keras.Input(shape=(64,64,3)), weights='imagenet')

# Freeze the layers
for layer in densed_model.layers[:101]:
    layer.trainable = False

for layer in densed_model.layers[101:]:
    layer.trainable = True

model2_balanced = tf.keras.Sequential()
model2_balanced.add(densed_model)
model2_balanced.add(Flatten())
model2_balanced.add(Dense(128, activation='relu'))
model2_balanced.add(Dense(1, activation='sigmoid'))


model2_balanced.compile(loss='binary_crossentropy',
              optimizer='adam',
              metrics=['accuracy'])
model2_balanced.summary()
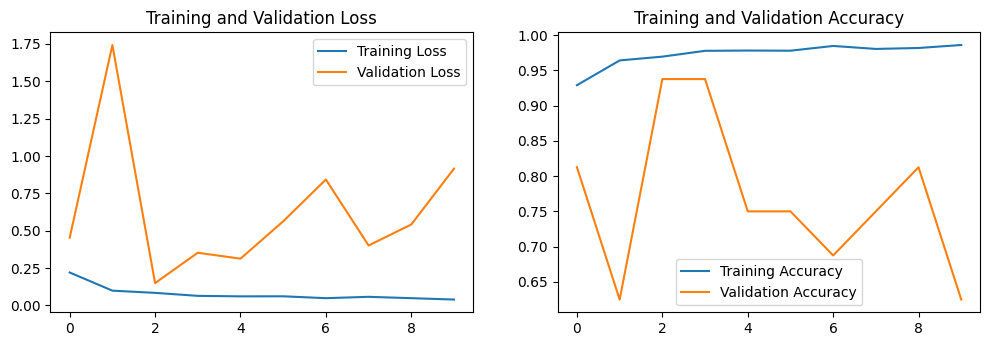
Based on the perfomance of model, we can deduce that the DenseNet model is slighty more accurate as comapred to the CNN model above.
Having evaluated our model, we ran our model against unseen validation data to ensure that our model is performing to a certain degree of accuracy.
Conclusion
| | CNN | DenseNet121 | | ----------------- | ----- | ----------- | | Training Accuracy | 96.6 | 98.5 | | Test Accuracy | 79.0 | 80.1 | | Loss | 0.823 | 0.987 |
Best performing model: DenseNet121
The best performing model turns out to be DenseNet121, given that it has the higher test accuracy of 80.1% with a reasonable loss of 0.987 as compared to the CNN model. When comparing a primitive CNN model to a state-of-the-art DenseNet model, it is clear that the DenseNet model has performed significantly better than CNN itself. This is because DenseNet models have many more layers and are generally more complex than simple CNN models. Our CNN model was able to produce a 96.6% training accuracy and 79.0% testing accuracy while our densenet models was able to produce a staggering 98.5% training accuracy and 80.1% test accuracy. DenseNet models are designed to address the vanishing gradient problem that arises in very deep neural networks. By incorporating shortcut connections between layers, DenseNet models are able to propagate gradients more effectively and learn more complex representations of the input data.
To answer the our problem statement of "how might we detect pneumonia for doctors in order to increase the efficiency and accuracy of diagnosis?", the underlying solution would be the use of the DensetNet model as a base to detect surface level pneumonia symptoms. This would establish a fundemental basis for medical professionals to use them as a tool to speed up their diagnosis of detecting the presence of pneumonia. Furthermore, this project has inspired us to think about the possibilites that technology can bring about such as the end to end process of diagnosis to a treatment plan, all with the help of such AI models and tools.
SC1015 Introduction to Data Science and Artificial Intelligence